In today’s data-heavy world where everyone touts the power of “Big Data,” companies track tons of data on their customers. If you’re using Excel, segmenting these customers based on specific criteria while also ensuring the database stays up to date may be more than Excel can handle. In our experience, Excel’s Data Model is an effective way for your FP&A team to utilize this data within the confines of tools they already have available and all within the familiar experience of Excel. Excel’s Data Model allows you to integrate data from multiple tables, effectively building a relational data source inside an Excel workbook. With Power Pivot and Power Query you can work with large data sets, build extensive relationships, and create complex (or simple) calculations, all in a high-performance environment.
Here are 5 signs that your Excel model could benefit from transitioning to a database model using Excel’s Data Model that leverages Power Pivot and Power Query tools:
1. The amount of data exceeds the physical limit for Excel.
Excel has a limit of 1,048,576 rows and 16,384 columns per sheet, which seems like a lot but for companies that track data on a transactional basis that limit can easily be exceeded. Excel’s Data Model allows you to store and analyze data without having to download it into tables in different Excel tabs. The Data Model is held in your computer memory rather than spreadsheet cells, so it doesn’t have the traditional one million row limitation. This means that you can store 10s (even 100s) of millions of rows of data directly in an Excel workbook in a highly compressed and performant way, and distribute it to other people without them needing to have access to the source database. This also helps your model from running into the spinning wheel of death from too many calculations just from opening the worksheet.
2. You are trying to run VLOOKUP or HLOOKUP functions on multiple parameters because you have multiple tables of data with connecting relationships between them.
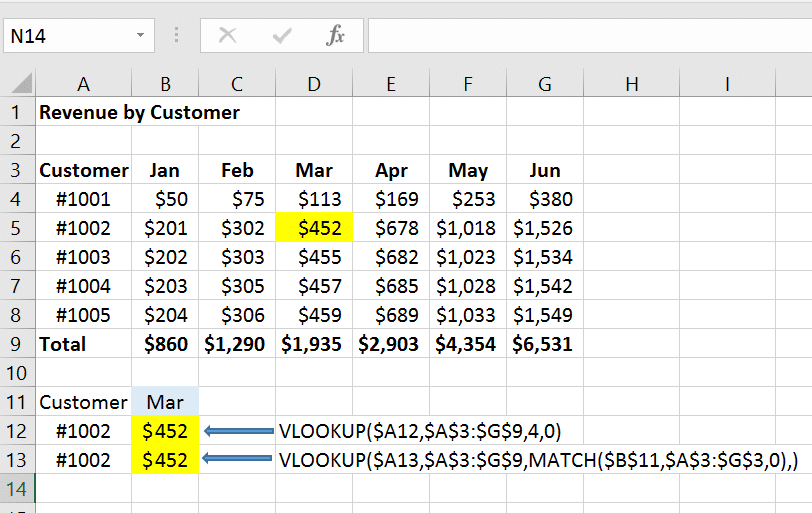
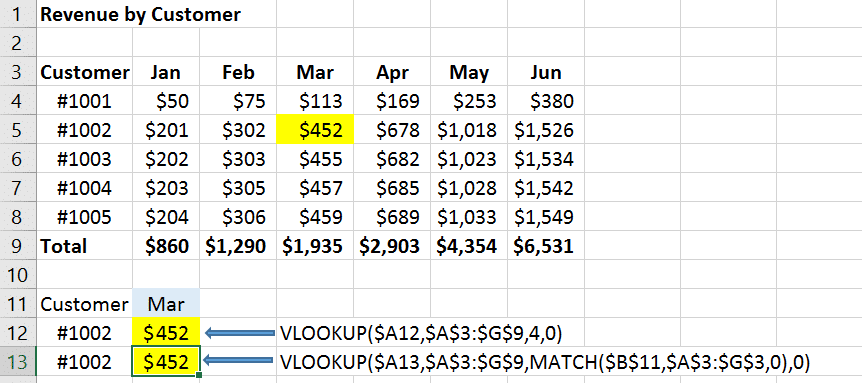
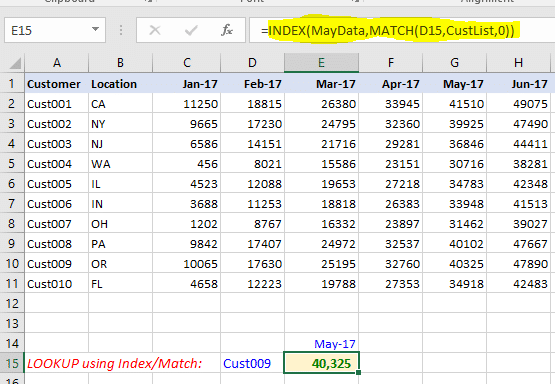
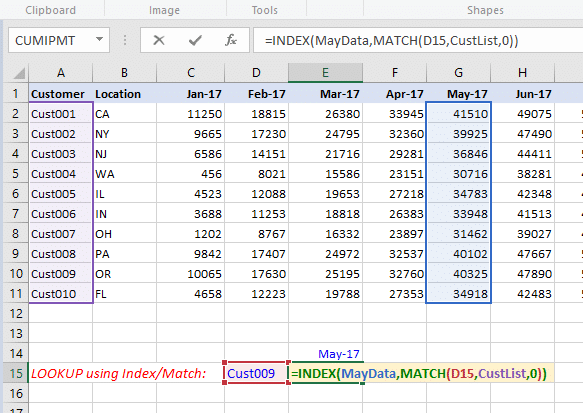
While the VLOOKUP and HLOOKUP functions are useful and common functions used in financial modeling, they can often become overused and bog down your model with calculations and make your model hard to follow. In addition, the LOOKUP functions are static so that if you end up adding or deleting columns, your LOOKUP formulas can easily break. Using a database relationship structure can help streamline your Excel model and keep it dynamic when adding and deleting data. Excel’s Data Model can create a relationship between multiple tables of data, based on keys in each table just like a traditional database structure. This allows you to forego the series of VLOOKUP’s to connect the data and allows you to use the data from any table in a connected fashion for any chart or pivot table in the workbook. You can use see and adjust the relationships visually in the Diagram View of the Data Model.
Related Content
3. Your data is dynamic and needs to be updated frequently.
Creating a link that pulls from an existing SQL table from your database takes out the step of downloading and copying over data requested from your company’s data team. Excel’s Power Query Get and Transform function allows you to import and connect your Excel sheet to external data so that all your calculations, charts, and reports are updated with a quick refresh.
4. Your data needs to be altered with several steps to work in your model.
If your team is having to do the same process repeatedly to alter your data for usage because the data output from one source is different than the way your team looks at data, Power Query can automate this process. A manual process for updating data can be a long tedious process of repetitive steps that are prone to error. Power Query is great in automating data alterations like changing data types, removing columns, filtering rows, pivoting data columns, or merging data. Setting up these steps once in Power Query can save hours of work and improve accuracy.
5. If your team isn’t using a tool like Power BI or Tableau but you would still like to have the ability to analyze and transform data and present clean reports and charts.
Power BI and Tableau are increasingly being adopted because they are great at taking lots of data from multiple sources and presenting clean, effective dashboards, charts and tables. However, they can also come with a hefty user subscription fee and a learning curve to boot. Excel’s Data Model paired with Excel’s Power Tools can offer many of the same functionalities as Power BI and Tableau. Excel’s Data Model allows you to pull data from multiple sources and the Power Tools built into Excel can build visual tables and charts using this data. With the Data Model, you can use Power Query for getting and transforming data to Excel, Power Pivot to manage the data stored in the Data Model, and Power View to present the data in reports. The user interface is intuitive and well laid out so your Excel Power tools function just like what your team is used to working with already. And the best part is that these tools are already available to all users that have Excel (PC version) without paying for a separate subscription.
Case Study
On my last engagement, I took the Client’s complex Excel financial forecasting methodology and built a model that allowed the Client to forecast and analyze their customer base by marketing channel and location by integrating the power of SQL queries, Excel’s Data Model, Power Query and Power Pivot all within the confines of an Excel workbook.
The finance team wanted the model built in Excel to align with their current skills and initially was exploring a structure with a labyrinth of millions of VLOOKUP and IF functions to pull in the data. Their data set was large enough that they would need to break up the uploads into multiple segments dates just to pull in all the data which meant even more formulas and lookups to account for this. Instead of this structure, I offered up a solution that instead utilized Excel’s Data Model and Power tools.
Utilizing these technologies, I was able to leverage their extensive customer data analytics by connecting Excel to their existing database through an ODBC driver. Using Power Query and Power Pivot tables with the Excel Data Model allowed me to both overcome the traditional Excel limitations for data and provide the Client an easy way to analyze any customer segmentation with simple filters and tables in a format the finance team was accustomed to using.
The result enabled the finance team to align their analysis to the same level of detail as their marketing decisions to attain more accurate forecasting and decision-making.


